
In the course of researching this topic, we discovered a very interesting YouTube channel, that broke this down in layman terms. NetworkBruh goes in detail what this topic and other CCNA topics is all about. I used his video to write this personal note for this topic.
This section in the CCNA blueprint covers interface and cabling issues that may arise in an enterprise environment. These include issues such as collisions, some operational errors, and mismatches in duplex or speed. Their names makes them sound like minor issues, but for an operational enterprise network, these are not just exam concepts, they are everyday realities that can cripple performance and business activity if left unchecked. A single bad cable, a mismatched speed setting, or silent Cyclic Redundancy Checks (CRC) errors can point to problems that may affect or even render the network services unusable bring down critical services and impact business continuity.
In the Open Systems Interconnection (OSI) reference model, these issues occur primarily at Layers 1 and 2. A solid understanding of these layers is fundamental, because before configuring complex enterprise systems or cloud integrations, network engineers must first ensure that the physical links and interface configurations are sound. More importantly, they should be able to recognize when something is wrong and troubleshoot it effectively.
For this discussion, we will explore how these issues develop, how they are detected, and why they remain critical to maintaining enterprise network reliability. Although modern networking equipment is designed to minimize many of these problems, their underlying principles are still vital to understand, especially since replicating them in a lab environment is often challenging.
Collisions: Problem Statement and the Evolution of Ethernet Switching
In the early days of ethernet, switches did not yet exist, and networks relied on network devices called hubs. As the technology matured, hubs were steadily replaced by more advanced and intelligent switches.
In the past, an ethernet hub was used to connect multiple devices. These broadcasted all incoming frames out every other port. If PC-A sent a frame, the hub simply flooded it to all remaining ports because it had no knowledge of destinations.
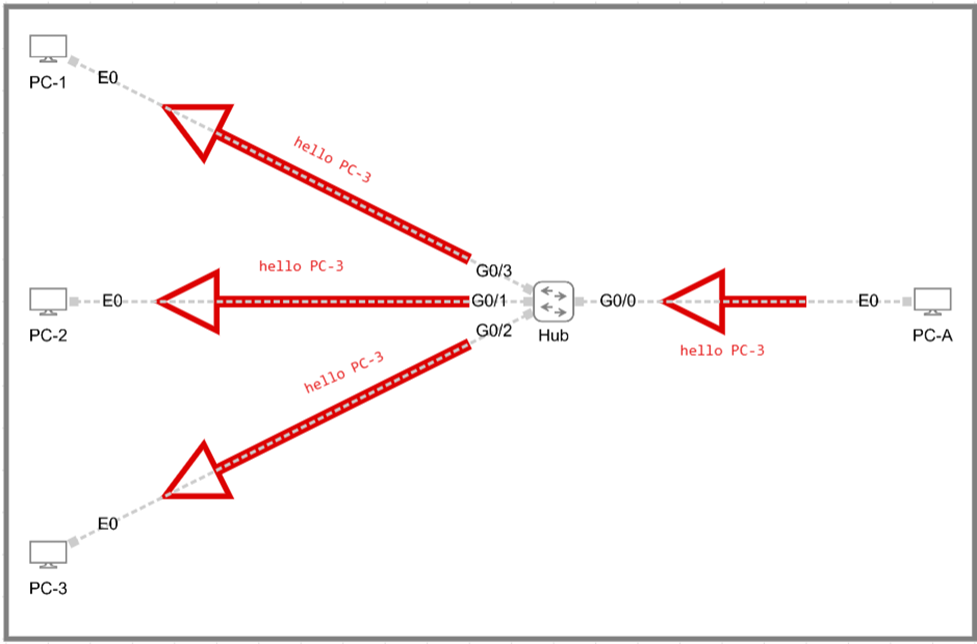
For this reason, hubs were often called “dumb” devices since they neither learned addresses nor made forwarding decisions. The drawbacks were clear: hubs created what we call a “single collision domain”, causing frames to collide and also requiring a complicated loop prevention mechanism. In modern enterprises, whenever a hub remained in a network, it was an operational and security liability.
Now, a switch, on the other hand has very effective knowledge of destinations, very much unlike a hub. The switch uses what we call Median Access Control (MAC) address table to effectively know the interacting MAC addresses. It works in such a way that when a frame arrives on a port, the switch records the source MAC against that port. The first time it needs to reach an unknown destination, it may flood (Address Resolution Protocol – ARP); once it learns where that destination lives, it forwards only on the correct port. That targeted forwarding reduces unnecessary broadcast like traffic and eliminates collisions when operating full duplex.
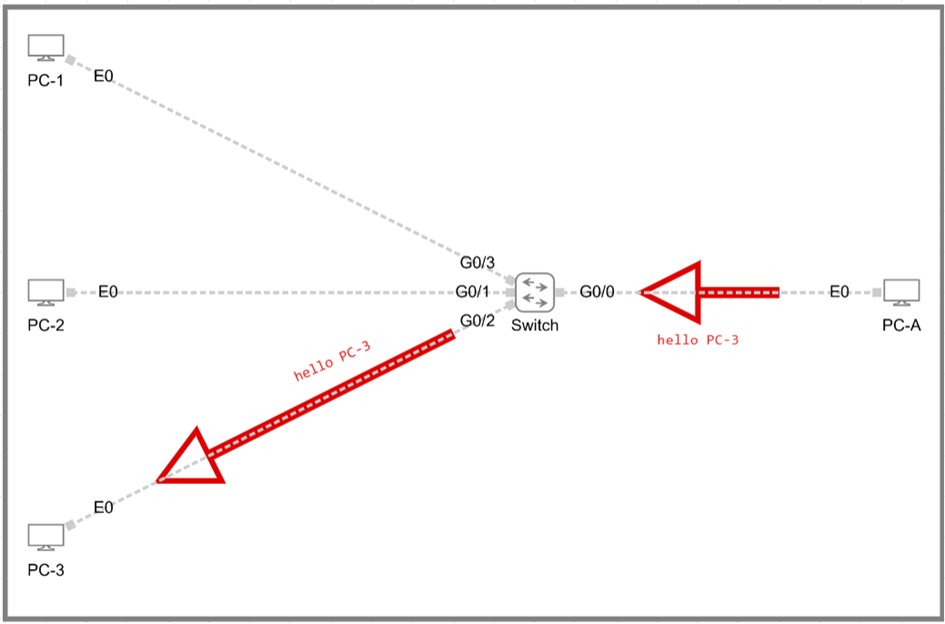
Hence, in switched Ethernet, each switch port and its attached device form a separate, independent link. Each of these links behaves on its own, typically in full duplex, which allows simultaneous send/receive and, therefore, no collisions on those links. You can think of each port-to-host connection as its own collision domain; compared to a hub, where the entire segment is one big collision domain, switched networks dramatically confine or eliminate collisions. Broadcasts still exist at Layer 2, but they don’t imply collisions the way shared-media hubs did.
Collison: Mitigation.
In the modern age today, ethernet is still the dominant enterprise networking framework and it can be described as a contention-based system that requires a shared medium i.e ethernet cables. This means that every device attached to the shared cables has the right to transmit. However, if more than one device transmits at the same time, a collision may occur.
To get a clear picture of this, imagine a set of nodes all tied into the same cable plant: they are sharing that medium. Sharing is good… except that in electronic communications, only one device can speak at a time. Think of it like a group conversation. Only one person can be understood at a time; if two people talk over each other, everyone else misses both messages. A two-way radio is a good analogy for half-duplex: push-to-talk, then release to listen. By contrast, a telephone is full-duplex-both sides can speak simultaneously without collisions.
Those collisions cause lost frames and retransmissions, reducing efficiency in the enterprise networks performance. To mitigate this, Carrier Sense Multiple Access with Collision Detection (CSMA/CD) was introduced into ethernet switching. This tech is structured in such a way that before transmitting, a station listens to the medium. If it hears silence, it sends; if it detects traffic, it waits a randomized interval before trying again. If a collision is detected, both senders back off and retry. That’s shared media ethernet in a nutshell: one speaker at a time, with rules to keep order.
One important thing you need to be aware of is that with a hub, the entire segment is one collision domain but with switches, each port along with its associated link is its own collision domain, and full-duplex operation removes the possibility of collisions altogether on that link. That’s why switching can be described as “smart,” scalable, and preferred for modern enterprise needs.
Recreating Errors
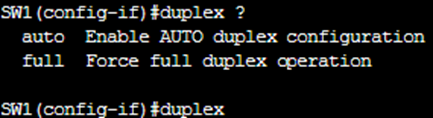
We tried to simulate these errors our virtual lab environment using Cisco Modelling Labs (CML). It however had us running some interesting limitations. On the Cisco router (R1), the duplex configuration options look like the below:
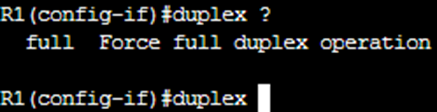
That’s it – no half-duplex option, no auto. Just full. On the switch (SW1), the situation is slightly different but with the same limitation:
Again, there’s no half-duplex option. This means that both the routers and switches in this simulation environment simply do not support half duplex configuration. The screenshots make it clear: R1 can only run full duplex, while SW1 allows auto or full, but nothing else. This matches what I have seen on the Linux endpoints in the topology (PC1, PC2, Server1, Server2). Those systems run Alpine or TinyCore Linux with BusyBox at the core. They can do basic networking with tools like “ifconfig” and netstat, but they do not let use adjust duplex or speed either. Put all that together, and the result is simple: we cannot recreate a classic duplex mismatch (full vs half), the scenario that usually produces late collisions and CRC errors in a physical CCNA lab.
Breaking Down Some Known Errors
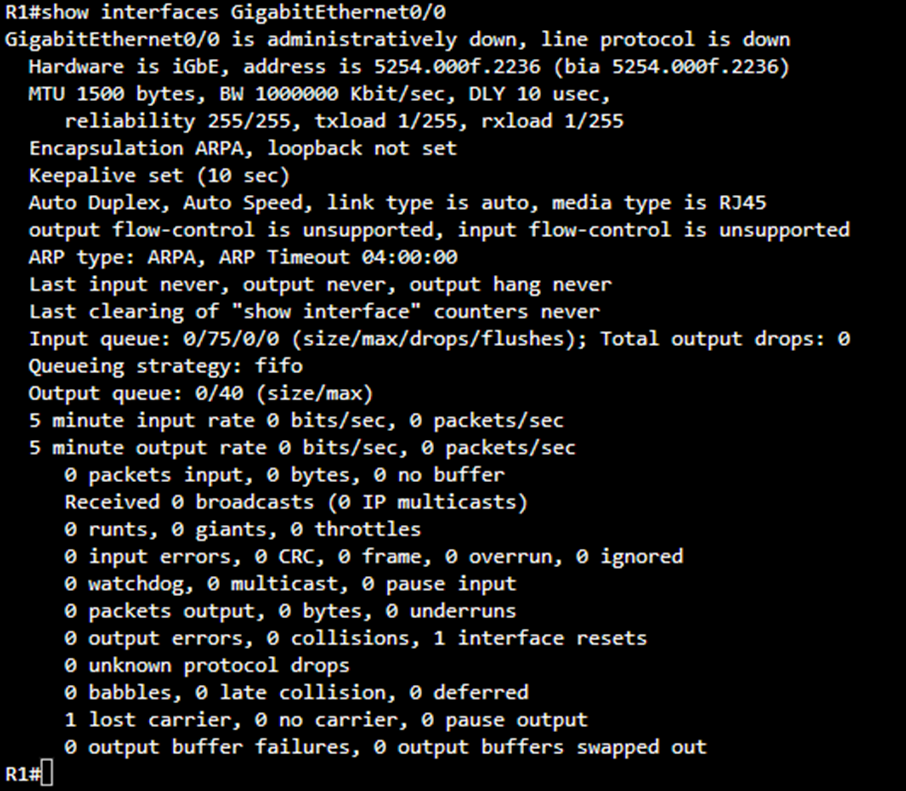
When you enter the command “show interfaces GigabitEthernet0/0” on a Cisco router or switch, the system displays a comprehensive report about the physical and logical status of that specific interface. This command is one of the most essential tools used by network engineers to diagnose interface health, detect cabling or hardware faults, and analyse traffic flow issues across the link. The output you have shown indicates that the interface is administratively down, which means that it has been intentionally disabled by configuration rather than by hardware failure or network disconnection.
Now when investigating these errors on the Cisco operating system, we us the “show interfaces” command. From the above screenshot, we can see the line that reads “GigabitEthernet0/0 is administratively down, line protocol is down” tells two different but related stories. “Administratively down” means that the interface was manually shut down by an administrator, typically using the shutdown command under interface configuration mode. Until it is re-enabled with the no shutdown command, the interface will remain inactive regardless of whether a cable is attached or not.
The phrase “line protocol is down” simply reflects that the data-link layer (Layer 2) is also inactive because there is no physical or logical carrier signal while the interface is administratively disabled. If this message instead read “up, line protocol is down,” it would usually indicate a Layer 1 or Layer 2 problem such as a faulty cable, mismatched duplex settings, or an incompatible speed configuration between devices.
The hardware and bandwidth section provides additional identification information such as “Hardware is iGbE, address is 5254.000f.2236” and “BW 1000000 Kbit/sec.” These lines confirm the hardware type and the default configured bandwidth. Although these do not directly indicate errors, they are helpful in verifying that the correct interface type and speed are being used. For instance, a mismatch in bandwidth expectation could contribute to queueing or throughput problems.
Further down the output, a large portion of the command output focuses on input and output statistics, which are critical for detecting physical-layer and data-link-layer errors. The following table summarizes the most important counters you will find in this section and how each one helps identify specific issues.

In our lab, all these counters are set to zero, which indicates that no physical-layer errors, collisions, or packet drops have been recorded. This is because this is a lab setting and in real life enterprise environment, these will be populated. When troubleshooting a live or active link, non-zero values in these fields are the first indicators of a problem. For example, a steadily increasing CRC counter often signals a damaged cable or connector, while late collisions point to a duplex mismatch between connected devices.
Next, the input and output queue information provides insight into internal packet processing. The line “Input queue: 0/75/0/0 (size/max/drops/flushes)” means that the input queue currently holds zero packets, can hold up to 75, and has dropped or flushed none. Likewise, “Output queue: 0/40” indicates that no packets are waiting to be transmitted and none have been discarded. If these values were rising or showing packet drops, it would suggest that the router’s processor or the interface queue is overloaded, potentially due to congestion or misconfigured quality-of-service policies.
The throughput statistics portion of the report, shown as “5 minute input rate 0 bits/sec, 0 packets/sec” and “5 minute output rate 0 bits/sec, 0 packets/sec,” displays the average data rate over the last five minutes. In this case, both are zero because the interface is shut down and not passing traffic. Under normal operating conditions, these numbers help identify unusual traffic patterns or confirm whether an interface is actively carrying data.
Finally, the collection of counters at the bottom, such as “watchdog,” “underruns,” “babbles,” and “output buffer failures”—are mostly low-level hardware indicators. Non-zero values here can point to deeper hardware or driver issues within the network interface card.
The command “show interfaces” or “show interfaces <interface_name>” is used to determine whether an interface is physically operational, administratively active, and free from transmission or reception errors.


